


Google Analytics provides a wealth of data – so much that you can easily get lost looking at behavior flow graphs or time on site reports. Or even remembering where those reports are.
Google Analytics Dashboards can help. They provide key data at a glance, so you don’t get bogged down in statistics and tables.
What are dashboards?
Google Analytics Dashboards let you display, in one place, the site data you care about the most. Like everything else in GA, the dashboards focus on either metrics or dimensions.
A dimension describes user characteristics. For example, the city dimension will tell you that your site visitor is located in Chicago.
Metrics, on the other hand, are quantitative measurements. Sessions, for example, is the total number of sessions, or visits, to your website. The metric pages/session indicates the average number of pages viewed during each session. The table below shows how Analytics displays this data.
| DIMENSION | METRIC | METRIC |
| City | Sessions | Pages/Session |
| Chicago | 2,379 | 4.23 |
| Milwaukee | 4.539 | 2.37 |
A dashboard can display up to 12 “widgets,” or displays of data. Every website in your Google Analytics account can have up to 20 dashboards. Although dashboards are completely customizable, each view of your website includes a default dashboard to get you started.

You can find your dashboards on the top of the Google Analytics menu on the left side.
Customizing Your Dashboard
If you’re running a targeted campaign, a customized dashboard can be a real time-saver. To create a custom dashboard, select the +New Dashboard option from the left menu.
From there, choose a blank canvas or starter dashboard. If you’re new to this, use the starter dashboard to get a feel for how the widgets work.
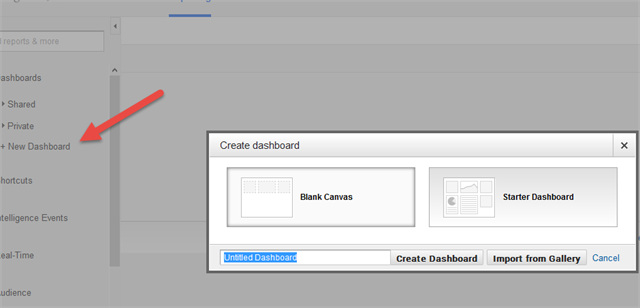
Select +New Dashboard from the left menu to add a new dashboard to your Google Analytics account. From there,
you can choose to add a blank dashboard or select a starter dashboard.
Next, select the 10 data pieces you review most often. We recommend:
- Visits
- Average Session Duration
- Visits by Traffic Type
- New Visits
- Bounce Rate
- Average Pages / Session
- Average Visit Duration
- Unique Visitors
- Goal Completions
- Pageviews by Landing Page
After determining what to measure, select +Add Widget from the top menu. All widgets link to specific reports. So, if you want more detailed information about your dashboard data, clicking a widget will take you directly to the underlying report in GA. That means you don’t have to try and remember where all the reports are found. You can simply click on the widget to view it in greater detail.
To use your dashboard for another website, click Share in the top menu bar and select Share Template. Paste the URL into your browser, select the property or view you want to add the dashboard to, and click create.
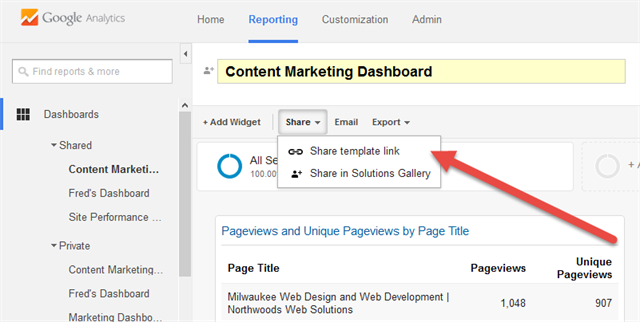
After you've created your dashboard, you can share it by selecting Share then Share Link Template from the the top menu.
Importing Dashboards
You can import dashboards developed by other users directly into your Google Analytics account. Not only can this save you time, it can also help you become more familiar with the dashboards generally.
If you find a dashboard you want to use, click the link and select the property or view to which you would attach the dashboard . (You must be logged into your GA account for this to work.) Don’t worry -- using someone else’s dashboard template won’t give them access to your data, and you won’t be able to access theirs. You are just copying their dashboard, not getting their data.
Dashboards You Can Use
At Northwoods, we’ve created four dashboards that we use extensively. An explaination for each dashboard is below. If you want to use them on your site, click on the link and add it to your Google Analytics account.
Digital Marketing Overview
This dashboard provides a high-level look at digital marketing efforts. You can review traffic totals, landing pages, and traffic type and conversion rates.
click image for larger view 
Use the Digital Marketing dashboard to a high-level view of your digital efforts.
(Click the photo to see it in greater detail.)
SEO
The SEO Dashboard provides an in-depth analysis of organic traffic. It is important to look at total organic sessions, as well as the search engines visitors used to arrive on your site. Although most search traffic comes from Google, consider also Bing and Yahoo. Search algorithms differ, so optimize for all search engines, not just Google.
Besides organic traffic, the SEO dashboard includes referral traffic widgets. Search engines use referral traffic to rank sites, so keep an eye on it.
Finally, do not forget about goals. In the SEO Dashboard, goal completion widgets tie directly to organic traffic and shed light on organic conversions.
The dashboard does not show Search Queries - the specific phrases visitors entered into Google before arriving on your site. Search Queries are found within the Google Search Console (formally Webmaster Tools). Because Queries are part of Search Console, not Analytics, they can’t be added to a dashboard. So, remember to review Search Console for a truly comprehensive view of SEO traffic. (If you’re unfamiliar, Search Console provides even more data about your website and visitors than you can find in Google Analytics. Luckily, Google provides great tips on setting it.)
click image for larger view 
The SEO Dashboard will shed light on the ways organic and referral visitors move through your site.
(Click the photo to see it in greater detail.)
Content Marketing
The Content Marketing Dashboard analyzes how visitors consume your content. Look at the total and unique pageviews widgets for your top pages. To understand how users engaged with content, review the Time on Page and Bounce Rate widgets.
The Content Marketing Dashboard also includes email campaign traffic data and landing page visits by new users. These slices of data provide insight into how visitors accessed content.
Finally, we have a landing page goal completion widget. This tells you which piece(s) of content drove conversions.
click image for larger view 
Use the content marketing dashboard to uncover how visitors are consuming your content.
(Click the photo to see it in greater detail.)
Social Media
The Social Media Dashboard highlights social successes. It breaks down traffic by channel, analyzes data hub activities, and connects social traffic to specific goals.
The basic widgets on this dashboard include total social sessions, historical social data, a breakdown of traffic by network and new visitors from social sites. Together, these metrics provide insight into brand awareness built through social media.
Social Data Hubs shed light on where people are engaging, sharing and discussing your content on other sites. Unfortunately data hubs only connect to a few social networks, including Reddit, Google+ and Meetup. They do not integrate with LinkedIn, Facebook or Twitter.
Finally, this dashboard is tied to specific goals so you can measure conversions coming from social traffic.
click image for larger view 
The social media dashboard will let you see visitors arriving from social media use your site.
(Click the photo to see it in greater detail.)