


As we create websites and software applications, we strive to meet business specifications and requirements and we consider the target audience.
But do we always look carefully and deeply enough at the real wants and needs of the user? Do we really know how easily – or with how much difficulty – they use the interactions and interfaces to complete their tasks?
User Experience (UX) processes can help us find out. If we involve users in the design process, we can be more certain of meeting user needs. In User Centered Design, data collected from testing actual target users – rather than assumptions made by the project team – drives the decision-making.
These tests must have some sort of deliverable that summarizes the knowledge any give test yields. The summaries make it easy for the project team to quickly review and confirm what was learned and thus ensure that the team designs and develops around user needs throughout the design process.
Contextual Inquiry
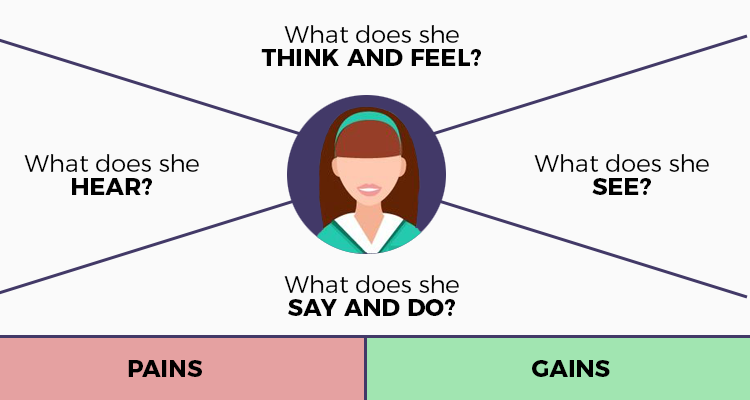
Users can tell us, from the beginning of a project, the problems they want us to solve for them. We discover and understand these problems through gathering qualitative and quantitative data, by conducting observations, interviews, and surveys. Often, we must help users recognize and define problems that they don’t completely understand themselves. And we must recognize that what users say can differ from what they actually do. We must get to know users, grasp their goals, appreciate their frustrations and build empathy for them.
We can visualize and illustrate findings from contextual inquiries through empathy maps. These maps pull together information from each piece of the inquiry. They will guide us through the next steps of the UX process.
At this point in the project, the team’s assumptions start to change. Sometimes our assumptions are correct. Sometimes they need adjusting. Contextual inquiry provides lots of a-ha moments about users’ issues. In some design processes, this is called Discovery. We learn what designing the “right thing” means to the user.
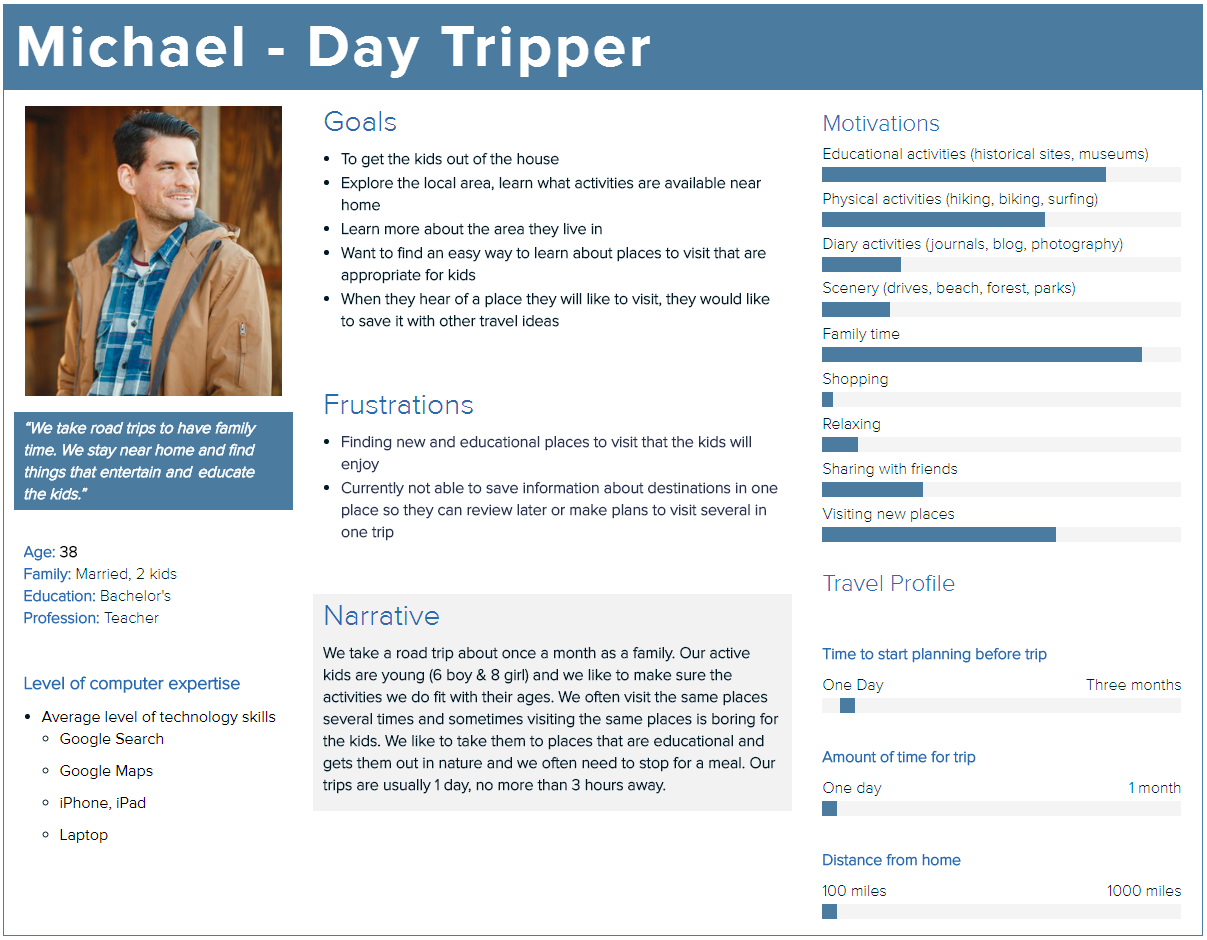
Personas also explain gains and pains (goals and frustration), and they show user demographics and motivations as related to the project. A persona usually aggregates several users or focuses on an archetypical user. The additional demographics construct a fuller sense of the user. As we study personas, we often find that we can personally identify with user needs.
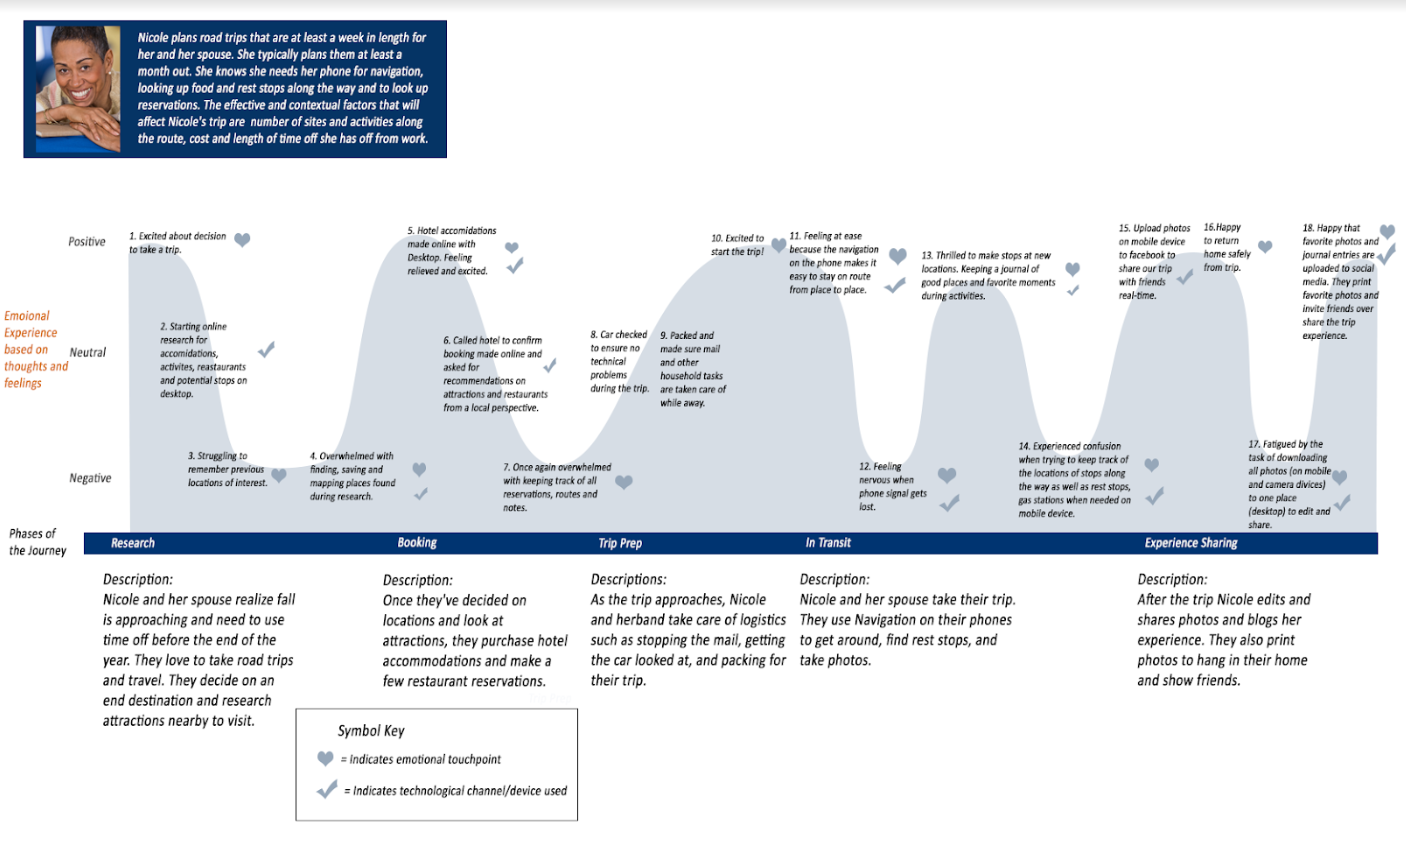
Another way to look at the user’s gains and pains is to map out the issues they have in completing a known task, such as planning a vacation. A Journey map shows the user’s emotions at each step of the task process. As UX practitioners, we learn where the high points of user satisfaction or low points of frustration are.
Once we understand the issues, we can identify and prioritize the areas of a website or application that need improvement.
Testing prototypes
From the Contextual Inquiry, we brainstorm ideas and start to look at possible solutions to user problems. We narrow down and prioritize those ideas and create prototypes to test with users to make sure our solutions meet their needs. At this point, depending on the project, there can be several kinds of prototypes.
Information Architecture
As we design Information Architecture, we often create a content inventory. We must know what content we have before we can organize it in a useful way. This arrangement – the Information Architecture – determines the paths users take through a website or application to successfully complete their tasks. Testing helps us match the content organization to users’ expectations.
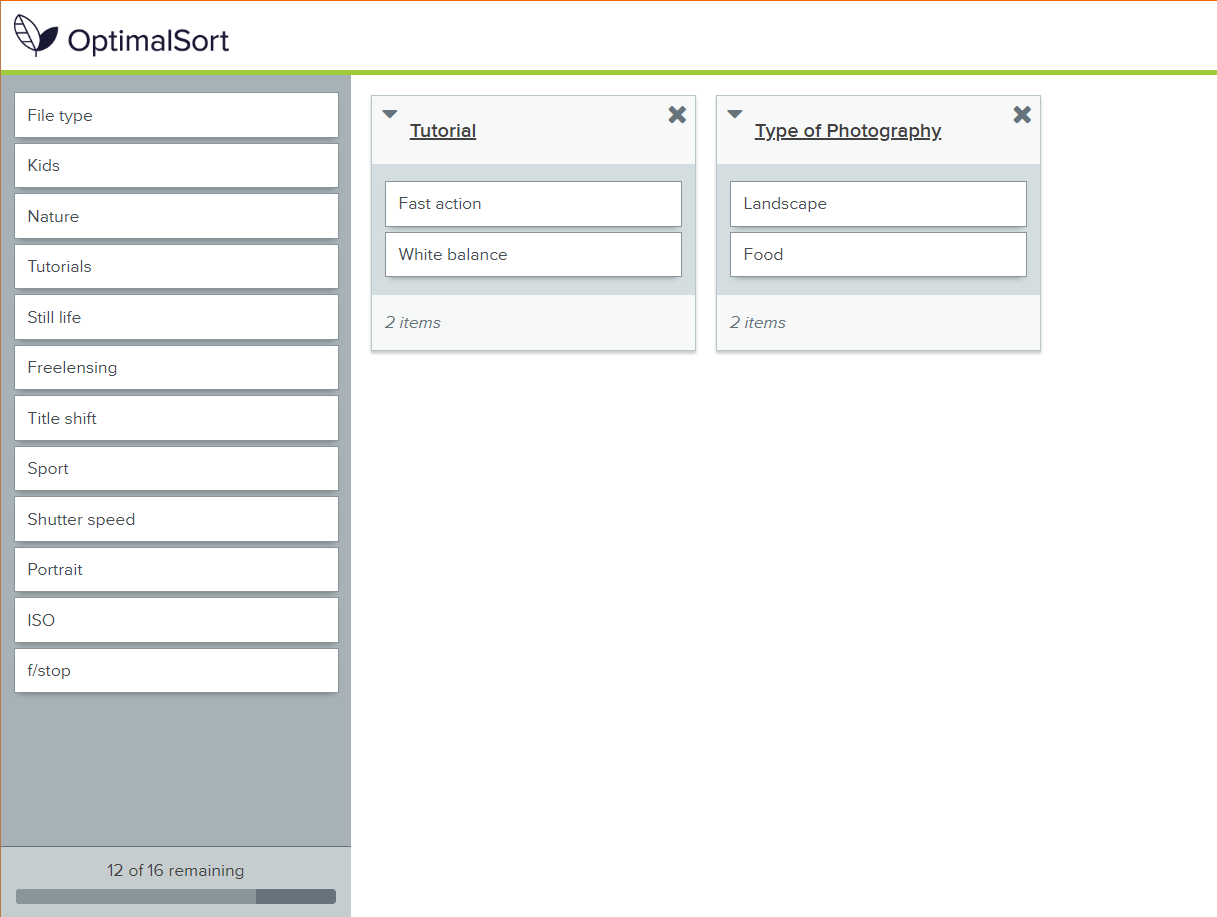
Card sorting is a great way to test content organization. Each card represents a page on the website or application with the wording of the page title. Users organize cards in the way that makes sense to them. Card sorts also test to see if the words on the cards fit the audience. If users don't understand the words onthe cards, they won't know how to find the information they seek.
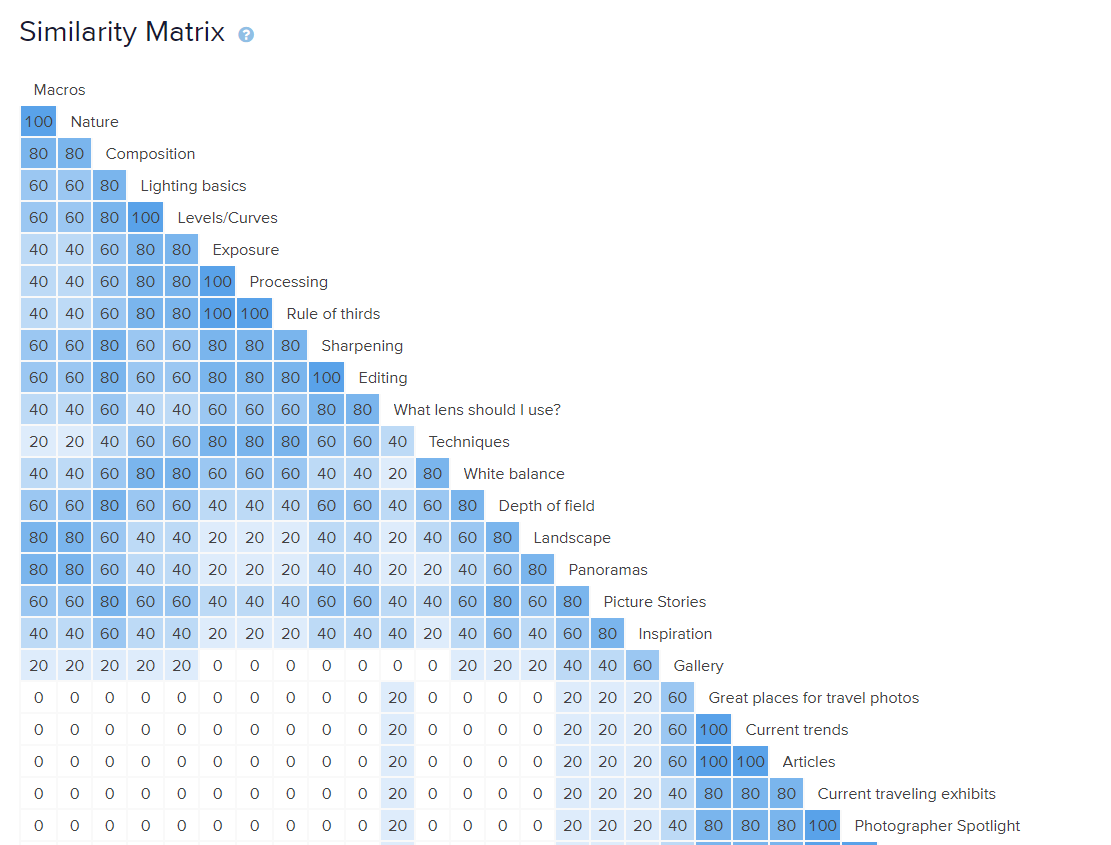
The following screenshots show an online card sort. These tests are easy to set up, and they can reach more users than in-person testing. Their results speed up the creation of project action items. The first screen depicts the online card sorting exercise where users group cards, the second shows us the results of how often certain cards were grouped together.
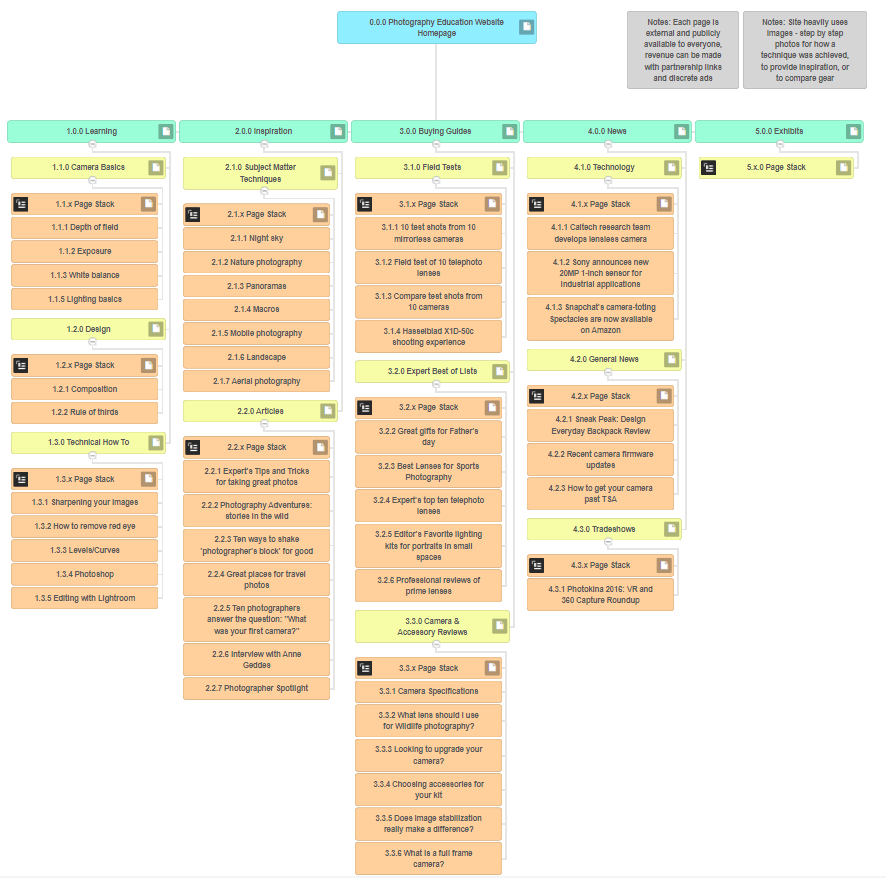
From what we learn in the card sort test, we create a site map. The site map is a visual representation that shows us the organizational structure of and how users will be able to navigate the website.
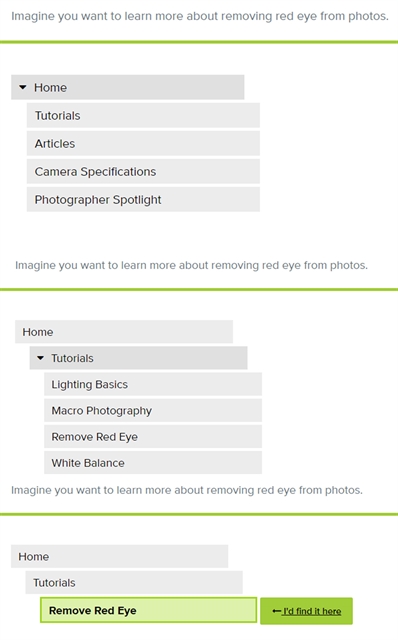
Using the sitemap, we can test the navigation paths by creating user tasks like “Imagine you want to learn more about removing red eye from photographs. How would you navigate to that page?” and test how easily test users were able to find the right page. Just like card sorting, site map testing can be performed online, to allow quick and easy test set-up and to expedite analysis of test results.
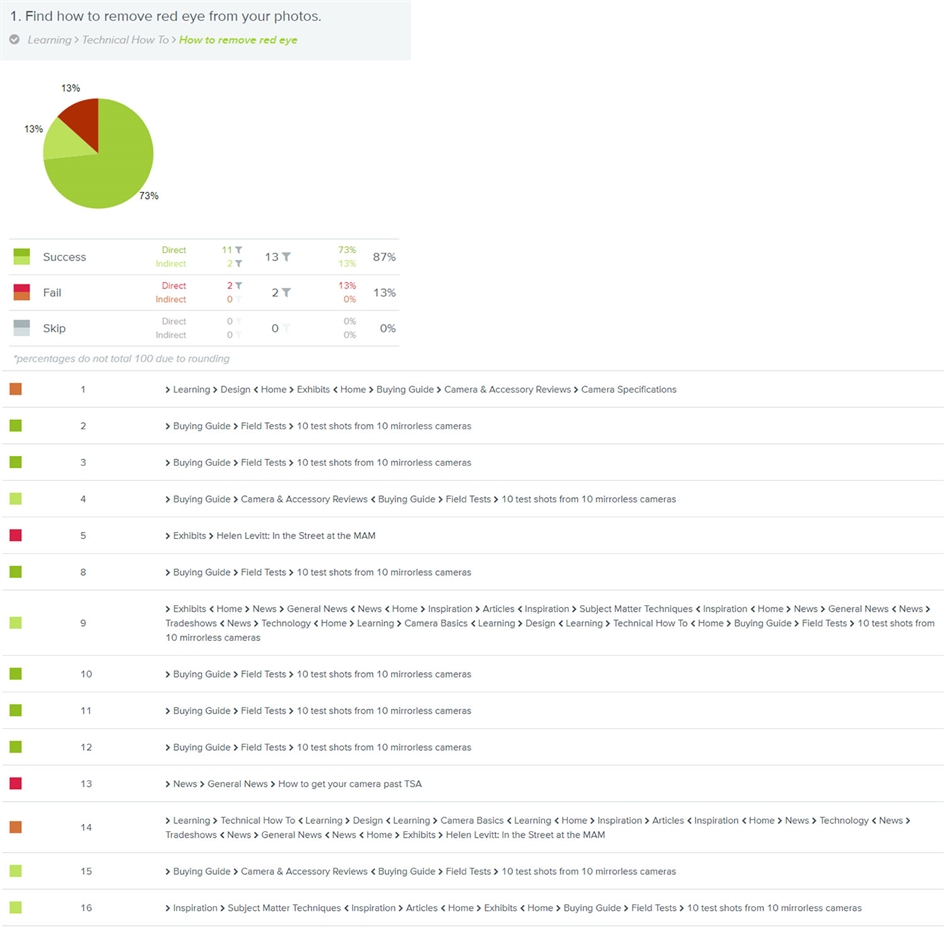
We track the number of successes and failures in navigating through the task. These numbers measure the effectiveness of the sitemap organization. The results also reveal the various paths people took to find their content. This knowledge allows us to adjust the sitemap to meet user expectations.
These online tests, for card sorting and site map, show us what people did. But they do not allow us to speak with the user to delve more deeply into issues they may have had. If we find many remaining issues after conducting these online tests, we might conduct in-person tests to get more qualitative data to help us structure the site content to meet the users' needs.
Wireframes
Once the sitemap is pretty clearly organized, wireframes help visualize how that navigation structure works with page layouts. Wireframes are like blueprints for a house. They show where content elements will reside on a page. They also show the types of content interactions available to users, such as how they navigate from page to page or interact with elements on the page.
For this mobile app, we conducted online testing to see if users were able to navigate to complete a given task, i.e., to find a parking space in Chicago near a particular restaurant. The test results showed us where on the wireframes people clicked during the test.
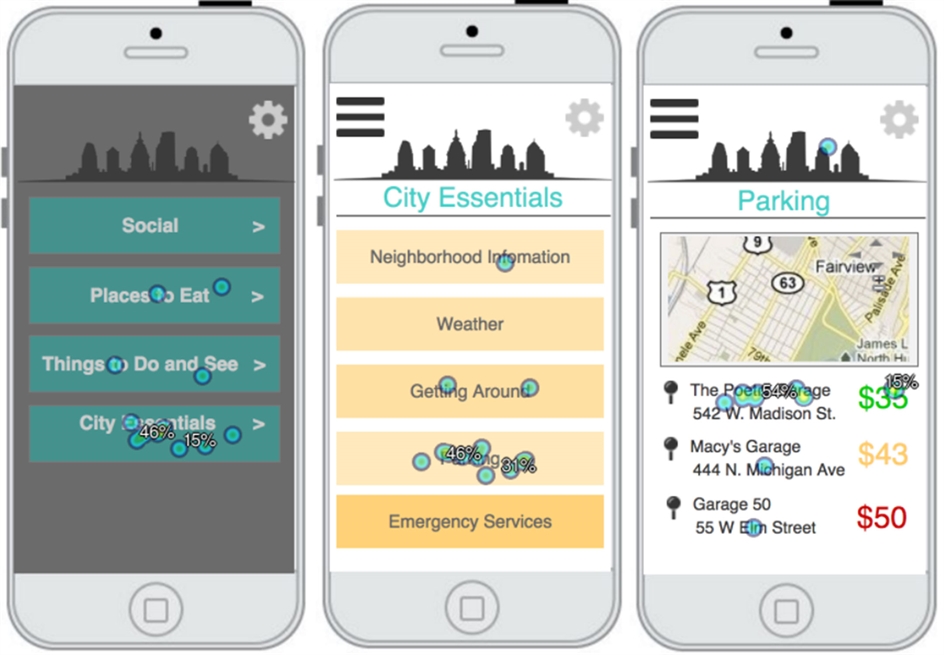
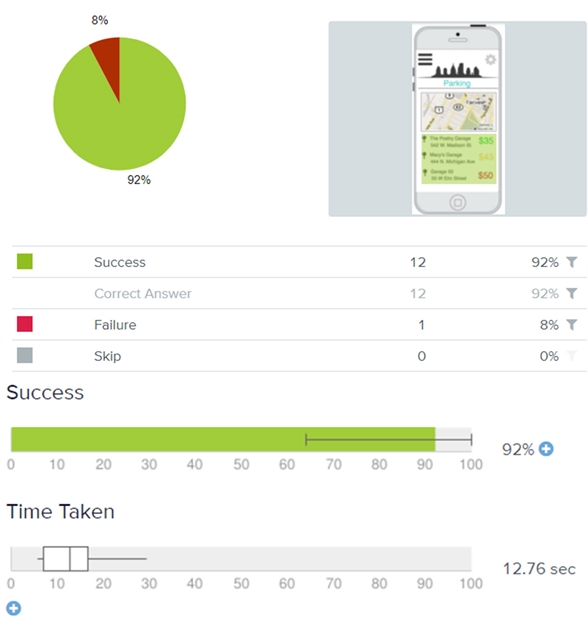
The test also told us success and failure rates and time on task. All this useful information helps us to see if users find our solution for the task acceptable. It can set benchmarks for variations of the design, so we can determine which variation best serves users.
We can conduct a different type of online wireframe test to gather comments and feedback from users. In another mobile app, we conducted remote, unmoderated testing, in which users were asked to join a study group in a school resource app. We could watch the video to see how they completed the task, and we could hear their running commentary.
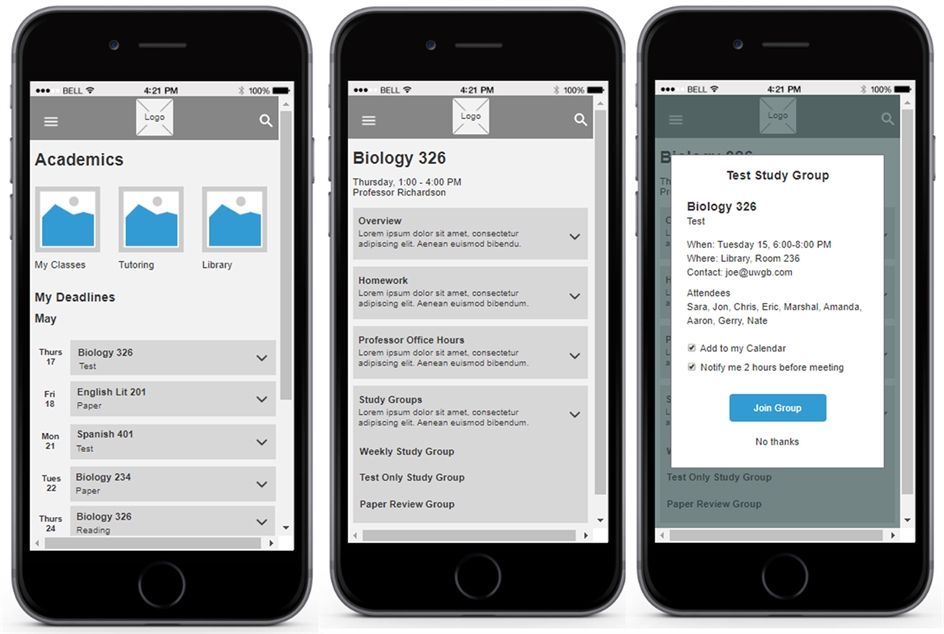
This think-out-loud feedback is invaluable.
We start with the contextual inquiry, where we watch and hear to learn what users need. But we don’t stop there. We gather similar feedback at later stages of the project; we want to know for sure that we are meeting user expectations.
We place importance on gathering different types of data (for example, quantitative data like how long it took to complete a task and qualitative data like if the user said they thought the task was easy to complete).
- Observation helps enormously; we need to know how many navigation mistakes users make and how much time they spend completing a task.
- Hearing what they say gives us greater insight to exactly what makes something easy or frustrating.
- We can revisit the Journey Map and see if our improvements have reduced the number of frustrating lows.
- With appropriate questions, we can determine if the design meets user needs – does it easily help them take care of tasks they need to complete?
All of our testing teaches us, at every step of the way, how to build the right thing and build it right for ease of use – as determined by users.