




Wallit by iMoneza
Software Development | Legacy Software Support
Northwoods Replaces Power BI With Native Reporting
Wallit is a paywall and subscription management solution built by iMoneza that helps content creators sell their content. Its mission is to bring content creators and customers together in a way that is sustainable, meaningful and profitable.
Northwoods has been the strategic web development partner to Wallit since its inception. Early in the platform’s formation, a business intelligence dashboard was created to provide strategic reporting to internal staff as well as their customers. Many of these reports were built using Power BI.
As Wallit’s business changed and the original developer was no longer available, the company faced a challenge that many organizations encounter after years of relying on legacy business intelligence platforms: the existing Power BI dashboard had become a critical reporting tool for the organization, but it no longer met the needs of the business.
The Wallit team faced three major issues:
- The ongoing cost of Power BI licensing and subscriptions continued to increase, making it difficult to justify the long-term investment.
- Qualified Power BI consultants were both difficult to find and expensive to engage, leaving Wallit dependent on specialized resources for even minor changes.
- The dashboard itself had become a legacy application. Reports no longer reflected the evolving needs of the business, and modifications or support were either prohibitively expensive or simply unavailable.
Rather than investing additional resources into an aging platform, Wallit sought a more sustainable approach. Using AI-assisted software engineering techniques, the Northwoods team reimagined and rebuilt the dashboard from the ground up.
The result was a modern, highly customizable reporting platform that eliminated ongoing licensing concerns, reduced dependence on specialized consultants, and delivered reporting capabilities aligned with current business requirements.
Most importantly, the project generated a return on investment in less than 12 months, demonstrating that organizations can modernize legacy analytics environments while simultaneously lowering costs and increasing agility.
Technical Details
The Situation
- Every report in Wallit was served by embedded Power BI. Six report models sat behind it, three of them no longer used; the twelve live report pages and a pinned-tile dashboard ran on the other three.
- Power BI Embedded ran on an A3 capacity: a standing, separately billed Azure resource, and an ongoing cost iMoneza wanted out of the stack.
- The embed relied on an older generation of Microsoft's reporting components and an out-of-date sign-in method for issuing report access. Neither had a future, which mattered as much as the bill did.
- Embedding constrained the interface. Reports rendered inside a fixed 820-pixel frame and had to be designed to fit it; an embedded report is a fixed box inside a responsive application. Load times were slow enough for publishers to notice.
- Tables behaved differently from one report to the next, so an improvement made in one place did not reach the others.
- Report labels, categories and aggregate definitions had drifted as the product aged, so the same term did not always mean the same thing from one screen to the next.
The Solution
- Northwoods opened with a full sweep and inventory of every Power BI dependent artifact, sorted into must-have, nice-to-have and do-not-migrate lists. That gave estimating and scoping something real to work from, and it was kept discoverable and fluid as the project went on rather than fixed at the start.
- The proposal converted two pages first: one simple, to prove the approach, and one highly complex, to bound the remaining backlog.
- For the charts, each visual was proven against mock data and agreed before being bound to production data and proven again. Separating those two questions, whether the visual reads correctly and whether it is right against real data, is what stopped the charts being the risky half of the migration.
- Northwoods put every tabular screen on one shared grid component, so a capability added once, such as CSV export or showing and hiding columns, reached all of them; a single change to the column menu landed across five report grids in one edit. The same pass rewrote report labels and categories that had drifted.
- The reports were rebuilt using libraries the application already carried, so no new licensed product was introduced, and the existing reporting warehouse stayed in place; only the Power BI capacity was retired.
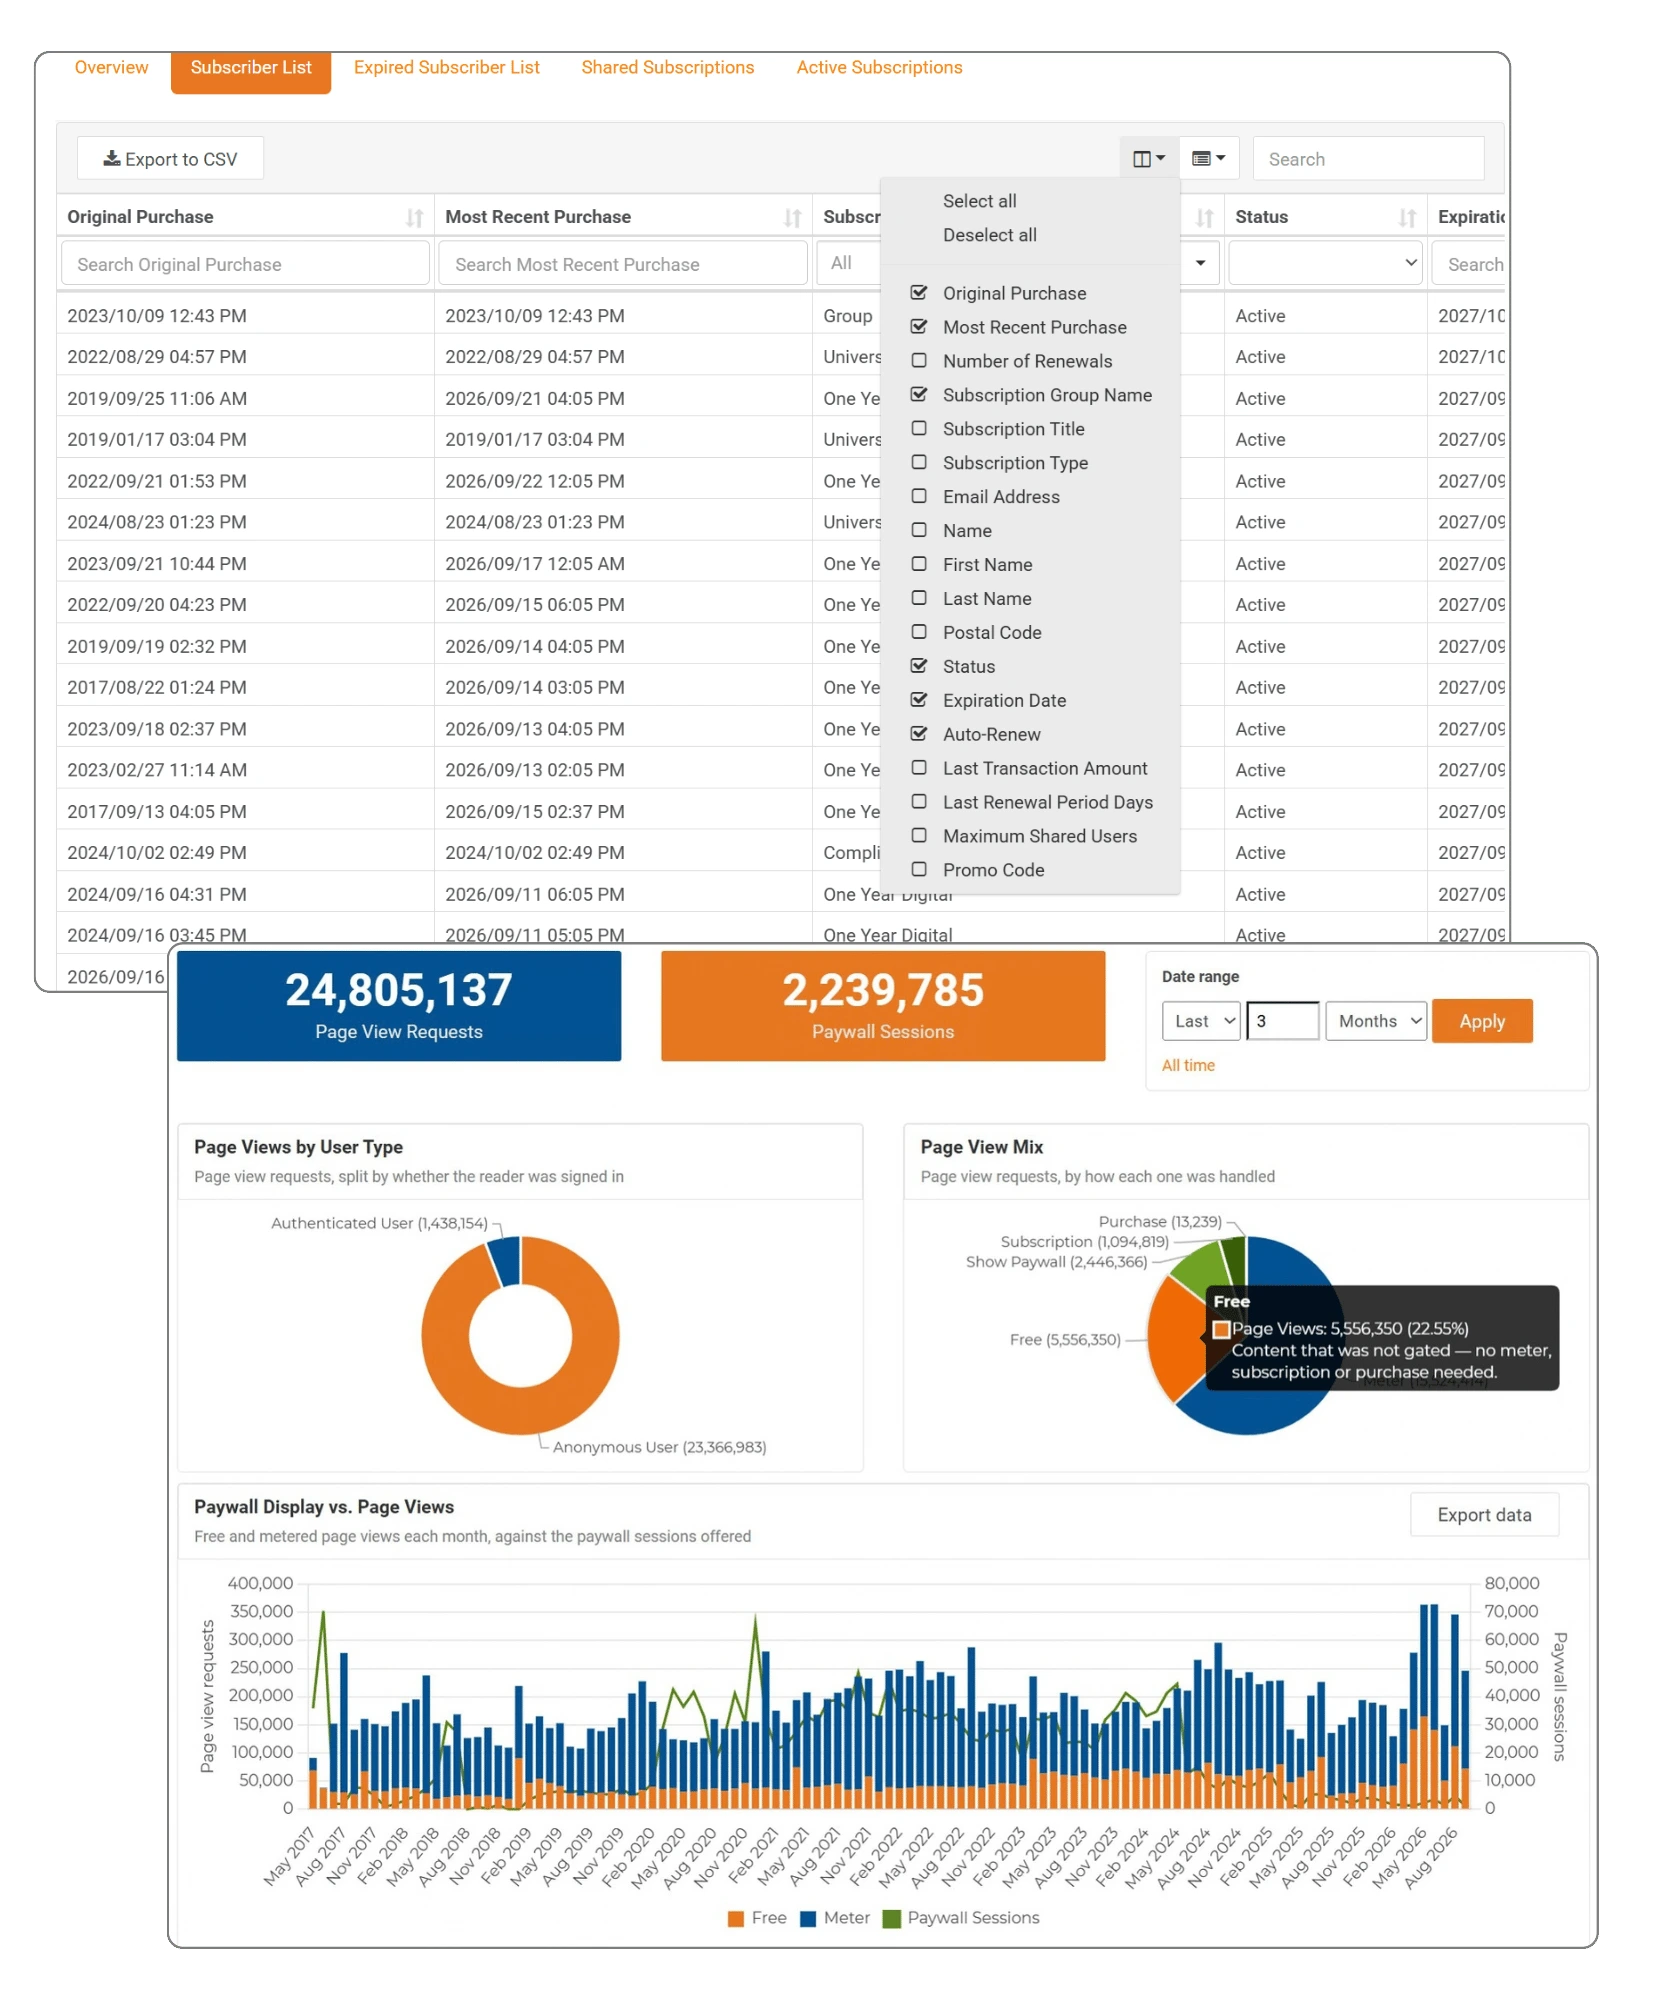

“Overall looking good. Frankly much more intuitive and functional than BI.”
— John Harrison, iMoneza · during the build, July 17, 2026
“an order of magnitude better than BI.”
— John Harrison, iMoneza · after go-live, August 20 2026
The Outcome
- Thirteen live items were inventoried, seven rebuilt natively and six retired, each with a stated reason. Power BI came out of the application entirely.
- Rebuilding created room to improve performance rather than only reproduce it, including how the reports retrieve their data. Cold first load on the Page Views overview fell by more than 90%, and warm loads by 30 to 60% depending on the range, with output verified identical to the original reports.
- Rebuilding to parity surfaced more subtle issues we could remediate as part of the work, including places where the original exports had not kept pace with the growth in data volume.
- A thorough review of the access model showed the patterns a well-used system accumulates over years: permissions no longer needed, configuration whose intent had become ambiguous, and room to formalize things against what we know now. Because success depended on parity, defining and comparing the before and after is what brought them into view, and the project became the occasion to inventory and organize them.
- Proving parity turned out to be business analysis as much as engineering. Terms had to be objectively defined: what a figure counts, and why. That meant working through with iMoneza what these numbers actually represent and how they would choose to represent them today.
- The project was completed in less than 90 days and delivered improved reporting as well as eliminating the cost of Power BI subscriptions.