


This post will look at the different tools that are available to help you investigate Core Web Vitals (CWV) on (almost) any site.
CWV collects real data, mostly gleaned from behavior of real users. That data reveals how well a website performs in terms of user experience. CWV points out where your website succeeds and – even better – where it falls short.
Google announced the Web Vitals project in May of 2021. It launched in June and was fully operational in August.
The Core comprises the three web vitals that, according to Google, best summarize a user’s experience with a website:
- Largest Contentful Paint (LCP): how long it takes the largest visible element to load. It’s usually an image, but it could also be a text block.
- Cumulative Layout Shift (CLS): how stable is the page as it’s built? Does it have elements that jump around as new elements load?
- First Input Delay (FID): how quickly does the website respond when you interact with it by, for example, clicking on a button?
A site with good CWV metrics will load the largest (visible) element quickly, appears stable as the page builds, and responds quickly to your interactions. Nice! That’s an experience that all website owners should want for their site.
CWV has another extremely powerful aspect: The web vitals initiative automatically collects data from Chrome sessions where users are logged into Google, so it collects a lot of data from real-world users visiting your site. This field data (RUM, which stands for real user monitoring) is collected in CrUX – the Chrome User Experience. CrUX is a massive BigQuery collection that is publicly available for exploration and analysis. It has data on about 8 million websites – likely including yours, as well.
Any reference to “real-user” data in the CWV tools is about CrUX.
Now let’s move on to options for exploring CWV on your own site – and on any site.
Chrome Extension
The simplest tool is a Chrome extension called, obviously enough, Core Web Vitals.
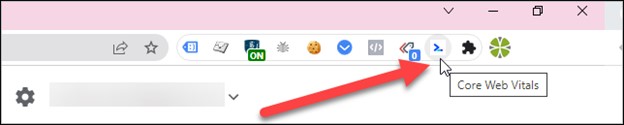
Install it from the Chrome web store to get instant CWV data about any site you visit. (Note that you must interact with the site to get the FID [first input delay] since it’s looking for, um, input.)
Because it’s a Chrome extension, it should run fine (theoretically) on other Chromium-based browsers. I’ve tested it on Edge, with good results.
The metrics look good on Patagonia’s home page (one of my favorite all-time companies):
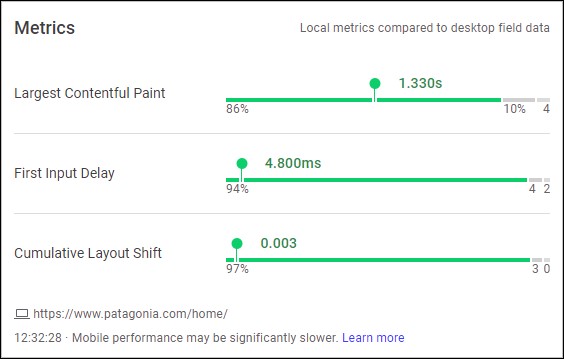
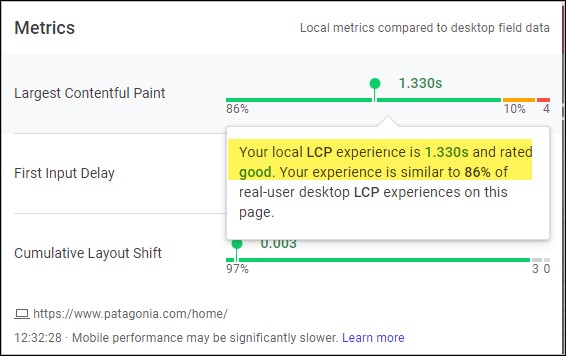
Hover over any of the metrics to see how your individual experience compares to other users (i.e., RUM data):
Pros
- Quick and dirty, with instant results
- Includes reference to real-user data
Cons
- It’s a snapshot in time of your browser, internet connection, session, etc. It might not be truly representative
- No long-term storage of results.
Best for: instant results
Dev Console - Lighthouse
Open up the developer console in Chrome or Edge, and you’ll see the Lighthouse option (CTRL-Shift-I for Windows, CMD-Option-J for Mac).
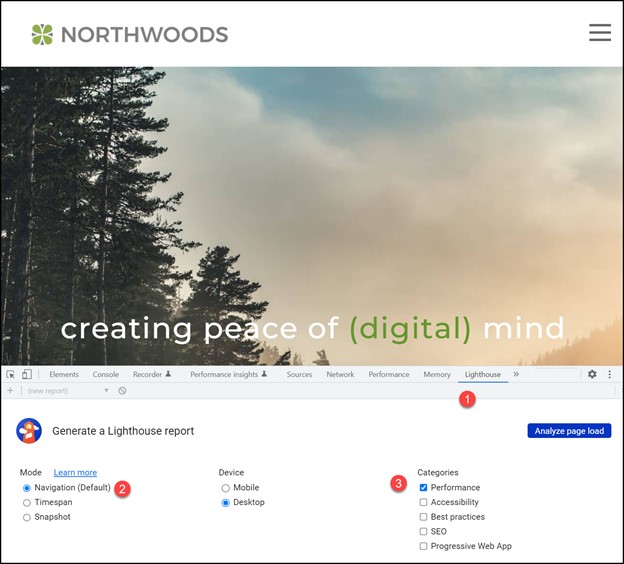
To get started:
- Go to the “Lighthouse” tab.
- Choose the “Navigation (Default)” mode.
- Choose “Performance” for the CWV tests.
Note that you can run it for either mobile or desktop (one at a time). Pro tip: run this from an incognito window, so your browser extensions don’t interfere with the results.
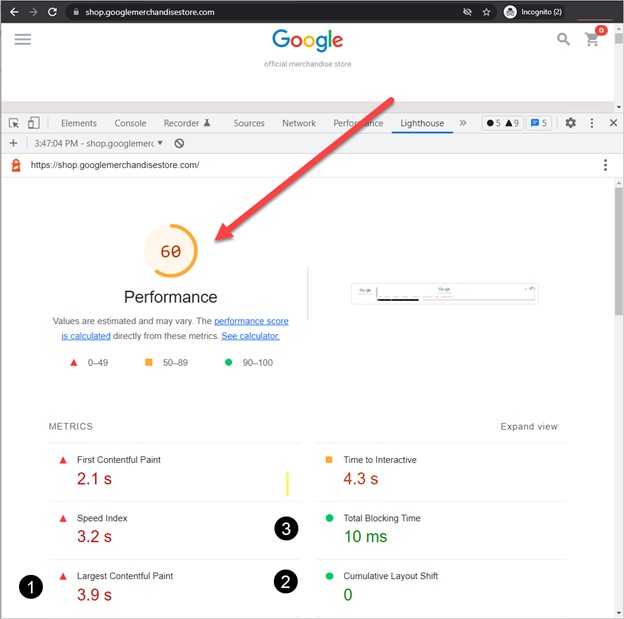
Let’s look at the results from the Google merchandise store. Notice both a cumulative performance score (based on the web vitals) and two of the three CWVs:
- LCP
- CLS
- But where is FID? Since FID is based on user interactivity with the site, and since Lighthouse can’t interact directly with the site, “Total Blocking Time” serves as a proxy for FID. (Remember that the Chrome Extension will give you FID, as long as you interact with the site.)
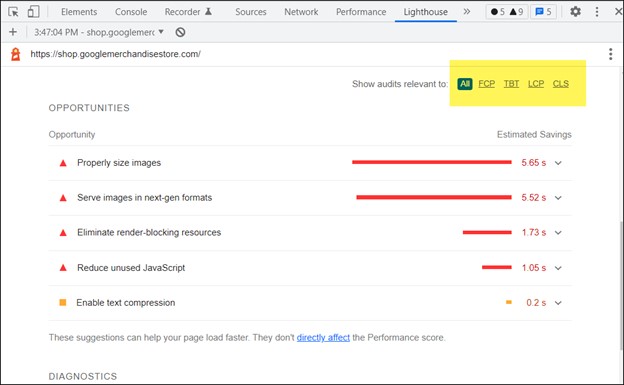
The big advantage of Lighthouse over the Chrome extension is the list of the worst-impact issues on your site. As a bonus, you can filter these results by the CWV type, i.e., you can choose to see only CLS issues.
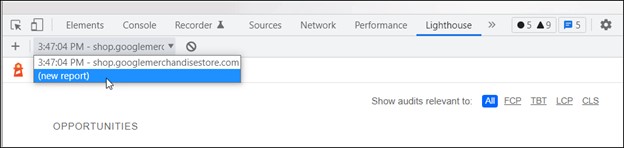
One last point on this topic: You can run multiple tests and then compare them one after the other, which is very useful when you’re making changes and want to test the result of those changes.
Pros
- Can run multiple tests to judge the effectiveness of any proposed improvements.
- List of the major issues on the site.
- Ability to sort issues by web vitals (very handy).
- Performance score.
Cons
- Not as fast as the CWV chrome extension (but much more comprehensive).
- No reporting on, or inclusion of, real-user data.
- Snapshot in time – your browser, computer, internet connection, etc. are in play.
- No long-term storage of results.
Best for: Testing – seeing the results of changes you or a developer are making.
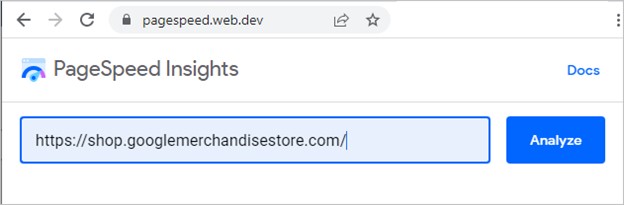
PageSpeed Insights
PageSpeed Insights is Lighthouse in a slightly more accessible format than Dev Console:
- You don’t run it from the developer’s console (so it’s less intimidating).
- You don’t have to be on the page you’re testing. Instead, you specify the URL you want to test.
- It automatically runs tests for both mobile and desktop results.
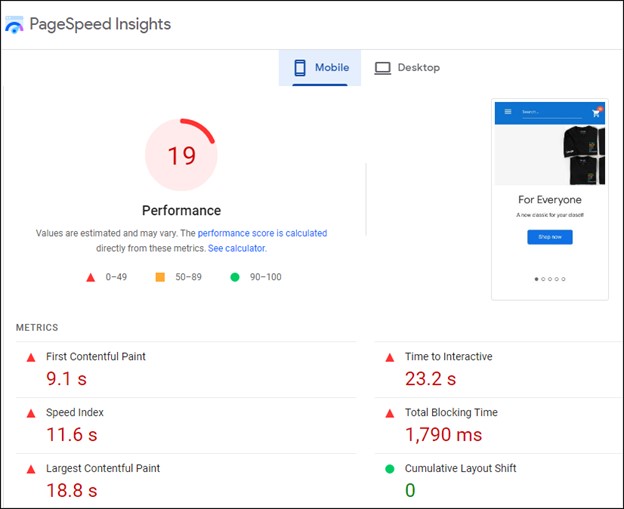
Like Lighthouse, from the Dev console you get similar Lighthouse results, along with a score.
In short, PageSpeed Insights offers very similar results to the dev console experience. But if you run both side by side, you’ll likely notice a few minor changes due to different versions of Chromium and Lighthouse.

One huge advantage of PageSpeed Insights over Lighthouse (in the Dev Console) is that it includes the real-world data from CrUX. Your specific results, of course, will be from your particular moment in time (your browser, PC, internet line speed, etc.)
Pros
- Can compare instantaneous results to real-user data.
- Easier interface to grasp than Dev Console.
Cons
- Can’t save the results.
Best for: Comparing live to real-user data.
Google Search Console (GSC)
Google Search Console is not technically a testing tool, so perhaps it shouldn’t be listed in this post. However, it offers very valuable CWV data, so let’s cover it briefly.
GSC summarizes and groups your CWV data, ranking your URLs as “good,” “needs improvement,” or “poor.”
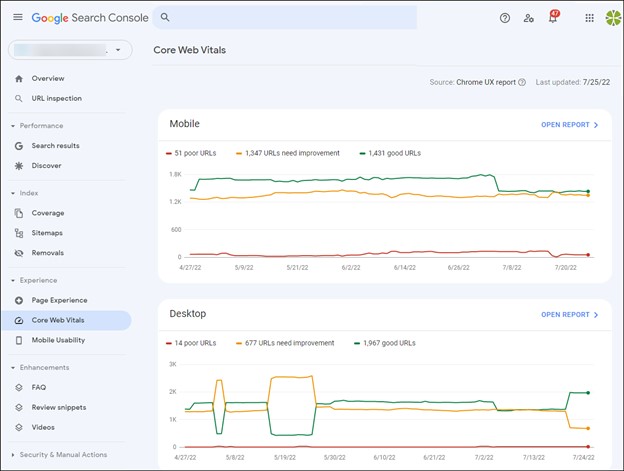
You can dive into a summary of the grouping of URLs.
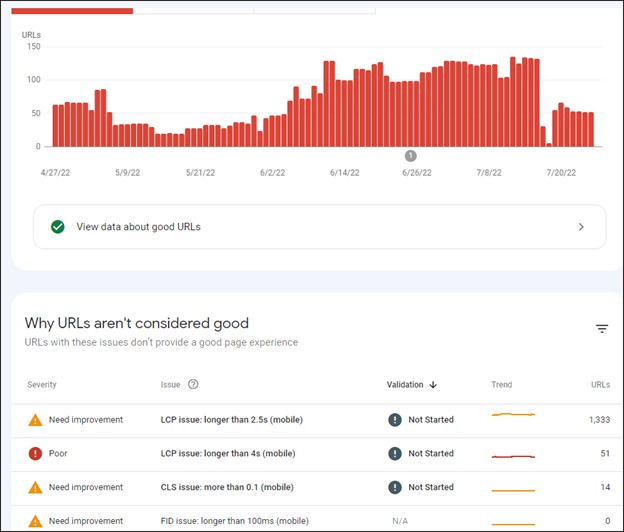
While GSC gives you a list of representative pages that performed poorly, for example, it doesn’t give you the in-depth information that Lighthouse provides on what the issue is.
But, in conjunction with Lighthouse and PageSpeed Insights, you could track down the issue, fix it, and then ask Google (in GSC) to validate the fix. (Validation may take up to 28 days.)
The data is excellent in terms of providing a summary overview of pages with issues, but it’s not complete by itself.
Pros
- Summary overview of your website.
- 90 days worth of data.
- Lets you ask Google to validate the fixes you made.
Cons
- Doesn’t give you the detailed suggestions of Lighthouse.
- Backwards looking – not suitable for testing changes to see their immediate impact.
Best for: A macro overview of the CWV health of a website.
CrUX Report
The flagship CWV reporting is the free, built-for-you template in Google Data Studio. It summarizes the experience of any of the websites in the CrUX BigQuery database.
To use it, you have to be logged in to Google; this will not work from an incognito mode window.
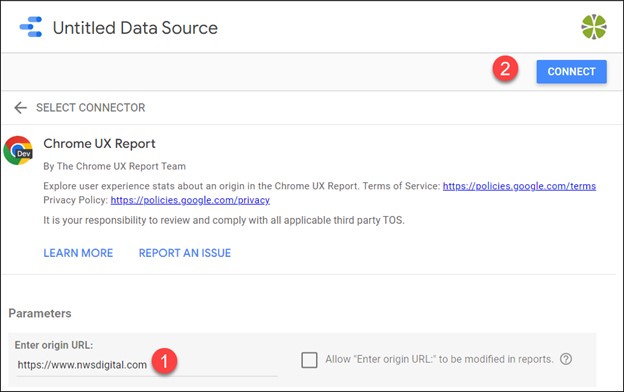
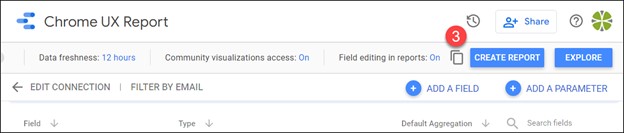
Type g.co/chromeuxdash to get started.
- Enter the full URL of the site you want to study. (Make sure to use the www or non-www version, whichever is the real, resolved URL of the site - e.g. https://www.nwsdigital.com).
- Connect the data.
- Create the report
You'll now have CWV info for the most recent month for which data is available. And – this is the best part – you’ll have several months worth of data for all the web vital metrics.
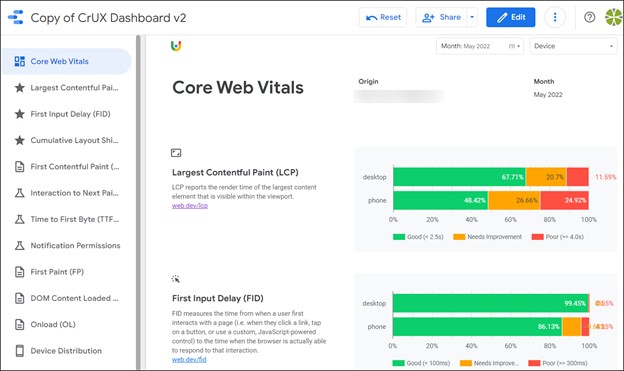
You can filter any of the reports by mobile, desktop, or both.
The data is static. It refreshes on the second Tuesday of every month. It’s a good habit to run the report in the middle of each month to see month-to-month trends.
API Access
Like Google Search Console, there are many SEO tools that offer CWV data in their reporting. Also like GSC, this data is not really great for testing; it’s historical. The tools (Semrush, Ahrefs, Link-Assistant, Moz, etc.) get the data using the CWV API, and most can even send warning emails if one of your metrics has tanked recently.
Conclusions
Here’s a summary of the tools we’ve considered:
| Tool | Instantaneous | Stores Results | Comparison to CrUX | Performance Score |
|---|---|---|---|---|
| CWV Chrome Extension | Yes | No | Yes | No |
| Lighthouse (from Dev Console) | No | No | No | Yes |
| PageSpeed Insights | No | No | Yes | Yes |
| GSC | No | Yes (90 days) | Yes | No |
| CrUX Dashboard | No | Yes (multiple months) | Yes | No |
My Personal Preferences
I tend to spend most of my time with three tool options:
- The Chrome web extension. It’s quick, it’s always on, and I can get instant feedback on any site I visit (plus tie in to real-user data)
- Lighthouse in Dev Console. I prefer Dev Console when I’m working with a front-end developer to tweak a site, or when I’m making changes on my own.I can run multiple tests, store the results (locally, for my session only) and make comparisons.
- The CrUX GDS report. I love this report. It offers such meaningful information and gives a great sense of the metrics over time. It’s one of the best examples of big data reporting I’ve run across.
If you need assistance with Core Web Vitals, our team is available to help. Don't hesitate to contact us!